The purpose of this article is to explain the functions of the Standard Dashboard for Thinkproject Analytics.
To open your dashboard, first log in to THINKPROJECT Here
Open the project in which you have access to a dashboard, by clicking the project tile in the My Projects section.
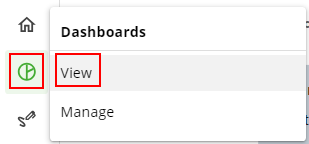
On the left side, open the module Dashboards and then choose View.
If your project supports multiple dashboards, the first one in the list will now be displayed.
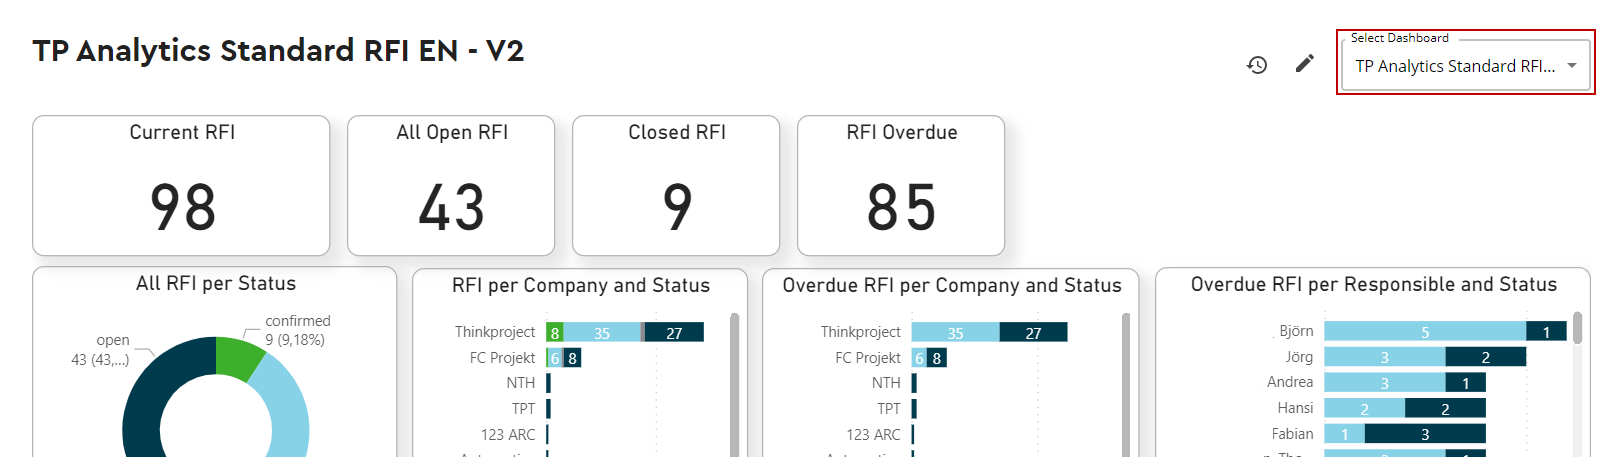
If your project contains multiple dashboards, that you are enabled to view, you can change the dashboard displayed by clicking the drop-down menu at the top right of the current dashboard.
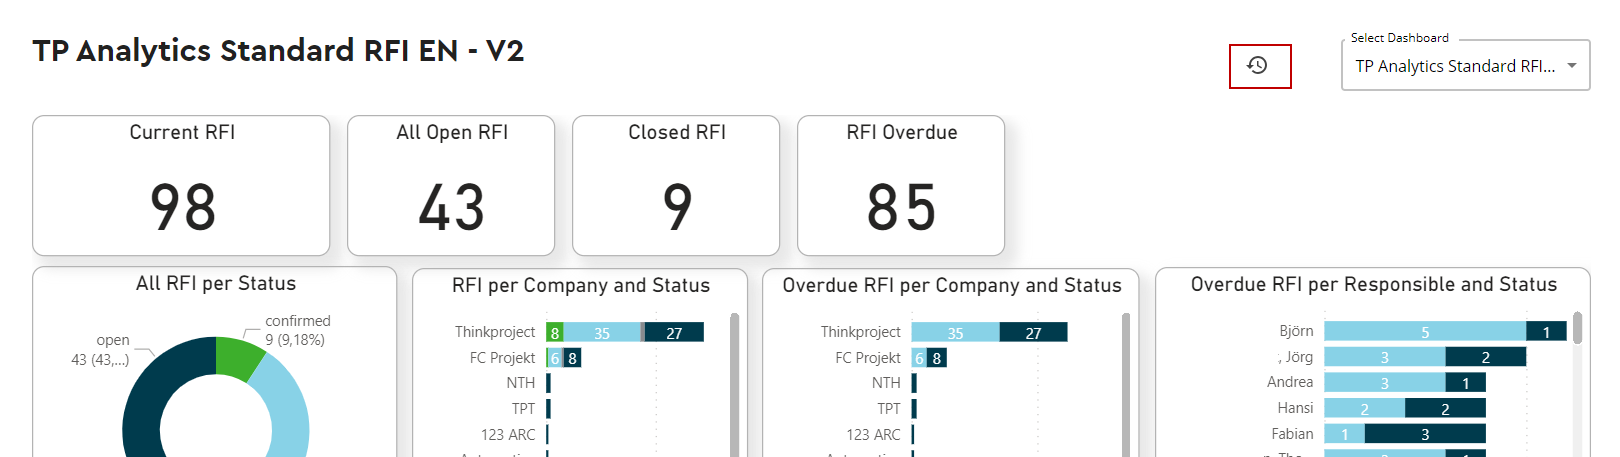
The dashboard is refreshed automatically every night.
Hovering your mouse over the Refresh section above your dashboard, shows you the date of the last refresh.
The data on the dashboard takes into account anything that was modified till the previous night. Changes to the project made today will reflect on the dashboard tomorrow.
By clicking on one specific value or i.e. status, the board shows only the data for this one value you clicked on.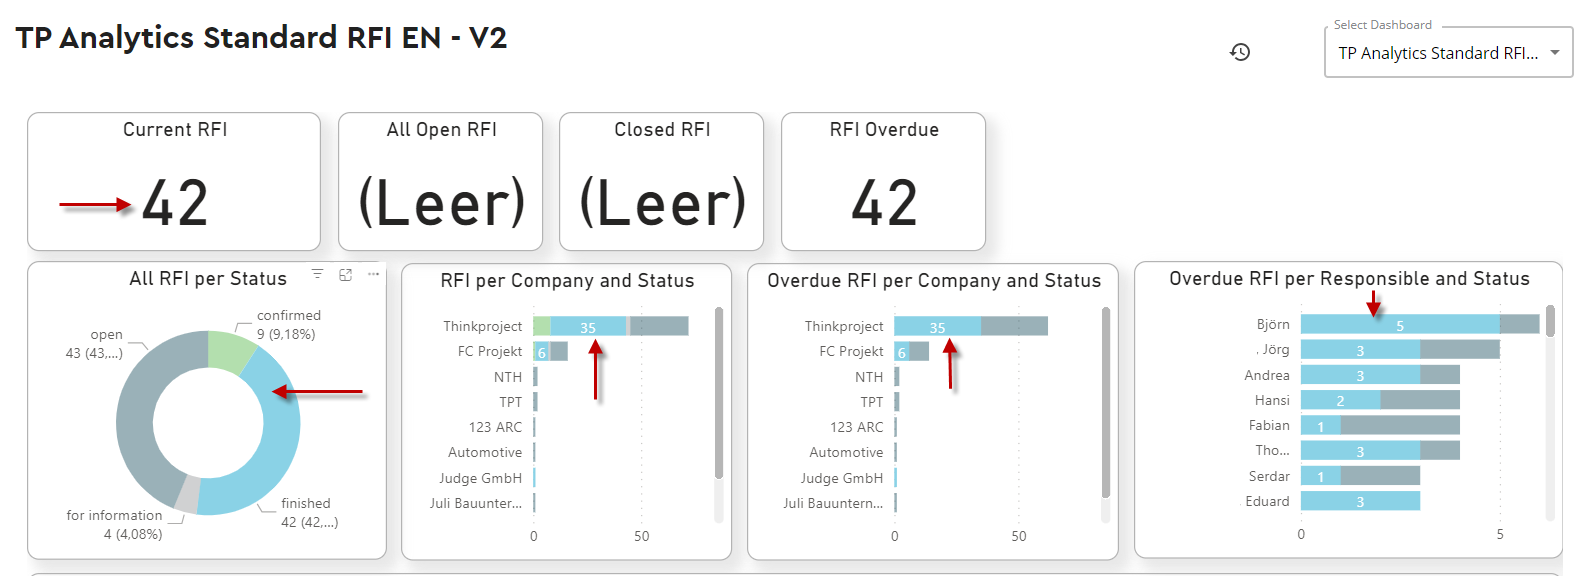
By clicking on the Value again, the original board will load and show all values.
You can choose between options to further enlarge, highlight, display or download the date of a single dashboard.
To enlarge one single report, click on the Enlarge -symbol
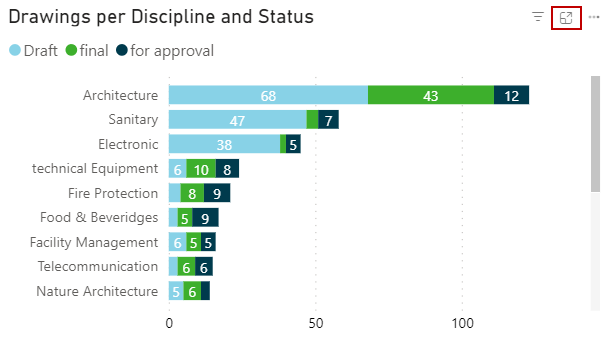
To return to the dashboard, simply click on return to dashboard in the upper left corner of the enlarged report.
To choose one of the other options, click on the three dots of the report in the upper right corner of the report you want to further explore:
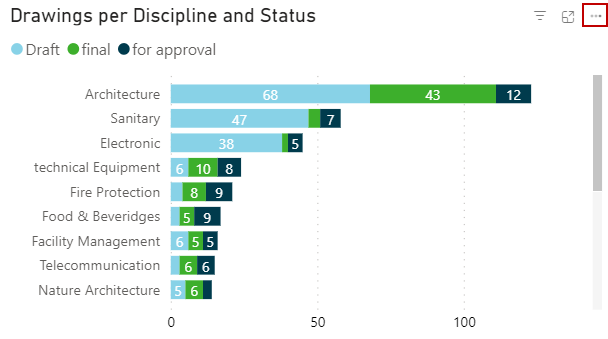
Here you can choose between different options:
1. Export data:
Here you can download the data of the applicable report as either xslx or csv file on your desktop.
Simply by clicking on Export Data. A new window opens. Here, you can select the file type and start the download by clicking on export.
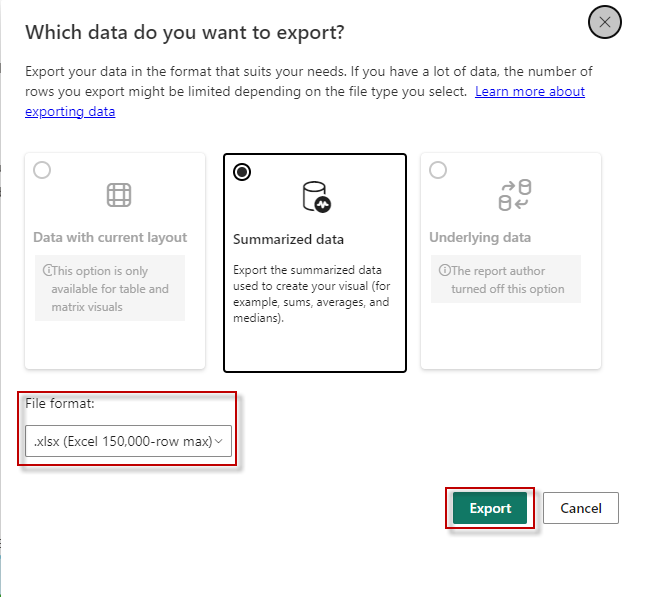
The file will then be saved within the download folder of your browser, desktop or your designated folder on your desktop.
2. Show as table
By clicking on show as table, the side reloads the report in a focus mode together with a table of the date of the report.
To return to the dashboard, simply click on return to dashboard in the upper left corner of the enlarged report.
3. Highlight
This option will put the selected report in clear colours and blurs out the others in order to focus on this one report.
Just click on the screen once again to stop the highlight mode.
4. Show as table
This option will display the chosen report in a focus mode and also display all its data in a table beneath the report.
To return to the dashboard, simply click on return to dashboard in the upper left corner of the enlarged report.